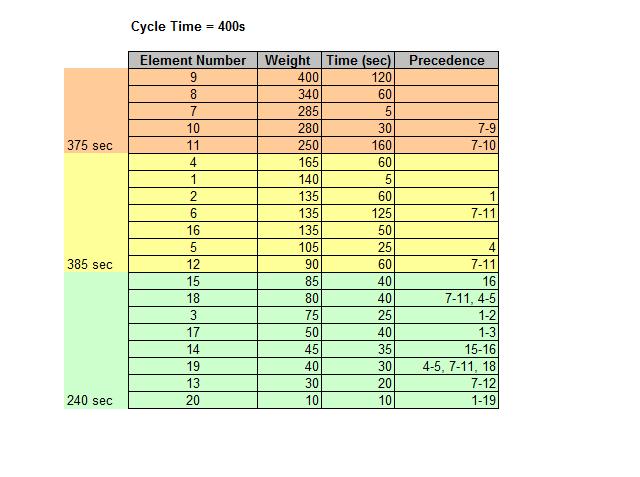
Weighted Table
Jump to navigation
Jump to search
The weighted table should be viewed with the Precedence Diagram. The cycle time is at 400 seconds. Our target is around 250 seconds, so either I have made a mistake or we need to use tools to reduce the time. I have grouped the work into different colours. Each colour represents a cell/workstation that needs to be executed in the correct order (red, yellow then green). Again, since our cycle time is so high we need to change this. Just regard the precedence diagram and weighted table a starting point.
