File:Ppat.1006562.g001.tif
Jump to navigation
Jump to search

Size of this JPG preview of this TIF file: 300 × 598 pixels. Other resolutions: 120 × 240 pixels | 240 × 480 pixels | 385 × 768 pixels | 513 × 1,024 pixels | 1,312 × 2,617 pixels.
Original file (1,312 × 2,617 pixels, file size: 4.08 MB, MIME type: image/tiff)
Captions
Captions
Add a one-line explanation of what this file represents
Summary[edit]
| Description |
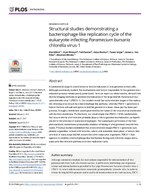
English: Host and viral membrane fusion generates a tunnel though which viral DNA is ejected.
A-G. PBCV-1-infected chlorella cells at 1.5–2 min PI were immobilized with HPF-FS and thick sections were analyzed by STEM tomography. A. A 5.2 nm tomographic slice from a 220 nm-thick STEM tomogram showing the close proximity between the viral and host internal membranes resulting from their convergence at the infection site. B. A 7.8 nm tomographic slice of a high magnification of the inset in panel A. C. A 5.2 nm tomographic slice from a different 220 nm STEM tomogram. D. High magnification of the inset of panel C. The generation of a continuous tunnel is evident. E, F. Two different 5.2 nm STEM tomography slices from the same tomogram showing the same PBCV-1-infected cells with almost completely empty capsids in which the membrane tunnel is still detected. G. A 5.2 nm tomographic slice from a 216 nm-thick STEM tomogram exhibiting an empty capsid attached near thylakoid membrane stacks (red arrowheads). In all panels the membrane tunnel and the protrusion of the host membrane are marked with blue and white arrowheads, respectively. Asterisk: viral DNA. H, I. Volume rendering representation of the STEM tomogram shown in panel A. The 3D surface representation highlights the barriers that viral DNA has to overcome to reach the host nucleus (including cell wall, plasma membrane, cytoplasmic vesicles, Golgi, and photosynthetic membranes that were not captured in this tomogram). A PBCV-1 virion is attached to the cell wall (brown). The host membranes as well as cytoplasmic vesicles are marked in blue. The capsid is depicted in yellow, the internal viral membrane and the membrane tunnel (arrowheads) are shown in blue. Viral DNA is shown in green. Scale bars: A, C, G: 100 nm; B, D, E, F: 50 nm. |
| Date | |
| Source |
https://journals.plos.org/plospathogens/article/figure/image?download&size=original&id=info:doi/10.1371/journal.ppat.1006562.g001 at https://journals.plos.org/plospathogens/article?id=10.1371/journal.ppat.1006562 |
| Author | Elad Milrot, Eyal Shimoni, Tali Dadosh, Katya Rechav, Tamar Unger, James L. Van Etten, Abraham Minsky |
| Other versions |
 |
Licensing[edit]
This file is licensed under the Creative Commons Attribution-Share Alike 4.0 International license.
- You are free:
- to share – to copy, distribute and transmit the work
- to remix – to adapt the work
- Under the following conditions:
- attribution – You must give appropriate credit, provide a link to the license, and indicate if changes were made. You may do so in any reasonable manner, but not in any way that suggests the licensor endorses you or your use.
- share alike – If you remix, transform, or build upon the material, you must distribute your contributions under the same or compatible license as the original.
File history
Click on a date/time to view the file as it appeared at that time.
| Date/Time | Thumbnail | Dimensions | User | Comment | |
|---|---|---|---|---|---|
| current | 15:51, 15 March 2021 |  | 1,312 × 2,617 (4.08 MB) | Ernsts (talk | contribs) | Uploaded a work by Elad Milrot, Eyal Shimoni, Tali Dadosh, Katya Rechav, Tamar Unger, James L. Van Etten, Abraham Minsky from https://journals.plos.org/plospathogens/article/figure/image?download&size=original&id=info:doi/10.1371/journal.ppat.1006562.g001 at https://journals.plos.org/plospathogens/article?id=10.1371/journal.ppat.1006562 50px with UploadWizard |
You cannot overwrite this file.
File usage on Commons
The following page uses this file: