Category:Parts-per-million chart
Jump to navigation
Jump to search
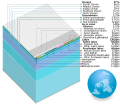
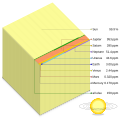
A statistical chart comprising a cube divided into 1 million (100×100×100) cubelets to show relative magnitudes or frequencies to parts-per-million granularity.
Media in category "Parts-per-million chart"
The following 12 files are in this category, out of 12 total.
-
 Atmospheric composition Langley cs.svg 512 × 657; 10 KB
-
 Atmospheric composition Langley.svg 512 × 657; 10 KB
-
 Earth water distribution es.svg 512 × 657; 10 KB
-
 Earth water distribution ko.svg 512 × 657; 10 KB
-
 Earth water distribution ppm chart.svg 512 × 448; 56 KB
-
 Earth water distribution.svg 512 × 657; 10 KB
-
 Element abundance earth ppm chart.svg 512 × 512; 62 KB
-
 Element abundance human body ppm chart.svg 512 × 512; 33 KB
-
 Solar system mass distribution ppm chart.svg 512 × 512; 20 KB
-
 Visualisation litre gram.svg 638 × 850; 4 KB
-
 Visualisation parts per 1 block.svg 512 × 640; 4 KB
-
 Visualisation parts per.svg 512 × 683; 3 KB


