Category:Our World in Data - Health
Jump to navigation
Jump to search
Subcategories
This category has the following 3 subcategories, out of 3 total.
*
H
S
Media in category "Our World in Data - Health"
The following 200 files are in this category, out of 765 total.
(previous page) (next page)-
 Access to clean fuels for cooking vs. GDP per capita, OWID.svg 850 × 600; 42 KB
-
-
 Access-to-clean-fuels-for-cooking-vs-gdp-per-capita (OWID 0010).png 850 × 600; 98 KB
-
-
 Age-standardized death rate from non-communicable diseases, OWID.svg 850 × 600; 29 KB
-
-

-

-
 Air-pollution-deaths-by-age (OWID 0074).png 850 × 600; 59 KB
-
 Alcohol consumption by tourists, OWID.svg 850 × 600; 7 KB
-

-
 Alcohol consumption by type of alcoholic beverage, OWID.svg 850 × 600; 6 KB
-
-

-
 Alcohol consumption per person in 2018 in European countries.svg 850 × 600; 27 KB
-
 Alcohol consumption per person, 1, OWID.svg 850 × 600; 14 KB
-
 Alcohol consumption vs. GDP per capita, OWID.svg 850 × 600; 44 KB
-
 Alcohol expenditure as share of total UK.svg 850 × 600; 26 KB
-
 Alcohol expenditure in the US since 1935, OWID.svg 850 × 600; 22 KB
-
 Alcohol-consumption-per-person-us.jpg 3,400 × 2,400; 133 KB
-
 Ambient-pollution-death-rates-2017-1990 (OWID 0072).png 850 × 600; 97 KB
-
 Annual change in average female height, OWID.svg 850 × 600; 15 KB
-
 Annual change in average male height, OWID.svg 850 × 600; 14 KB
-
 Asperger Syndrome prevalence in males vs. females, OWID.svg 850 × 600; 41 KB
-
 Asperger-syndrome-prevalence-males-vs-females.png 3,400 × 2,400; 478 KB
-
 Autism prevalence in males vs. females, OWID.svg 850 × 600; 41 KB
-
 Average adult height by year of birth, OWID.svg 850 × 600; 14 KB
-
-
 Average height of men by year of birth, 1, OWID.svg 850 × 600; 9 KB
-
 Average height of men by year of birth, 2, OWID.svg 850 × 600; 139 KB
-
 Average height of men by year of birth, OWID.svg 850 × 600; 7 KB
-
 Average per capita supply of pulses, OWID.svg 850 × 600; 12 KB
-
 Avertable-deaths-from-rotavirus-with-full-vaccine-coverage.png 3,400 × 2,400; 457 KB
-
 Breakdown of child mortality by cause, OWID.svg 850 × 600; 9 KB
-
 Burden of disease by cause, OWID.svg 850 × 600; 14 KB
-
 Burden of disease from injuries, by age, OWID.svg 850 × 600; 11 KB
-
 Burden of disease, by age group, OWID.svg 850 × 600; 17 KB
-

-
 Cancer death rates by age group, OWID.svg 850 × 600; 7 KB
-
 Cancer death rates by type, OWID.svg 850 × 600; 20 KB
-
 Cancer death rates in the United States over the long-run, OWID.svg 850 × 600; 20 KB
-
 Cancer deaths by type, 1, OWID.svg 850 × 600; 19 KB
-
 Cancer deaths by type, 2, OWID.svg 850 × 600; 32 KB
-
 Cancer deaths by type, OWID.svg 850 × 600; 45 KB
-
 Cancer-deaths-by-type.png 3,400 × 2,400; 742 KB
-
 Cardiovascular disease death rate vs. GDP per capita, OWID.svg 850 × 600; 36 KB
-
 Cardiovascular disease death rates by age, OWID.svg 850 × 600; 17 KB
-
 Cardiovascular-death-rate-vs-gdp-per-capita (1).jpg 3,400 × 2,400; 289 KB
-
 Cardiovascular-death-rate-vs-gdp-per-capita.png 3,400 × 2,400; 629 KB
-
 Cardiovascular-disease-death-rate-over-time-males-vs-females.png 3,400 × 3,398; 896 KB
-

-

-
 Causes of death in children under 5, OWID.svg 850 × 600; 18 KB
-
 Causes of death in children under five years old, OWID.svg 850 × 600; 35 KB
-
 Causes of death in under-5s, OWID.svg 850 × 600; 18 KB
-
 Causes of deaths for 15 to 49 year olds, OWID.svg 850 × 600; 18 KB
-
 Causes of deaths for 50 to 69 year olds, OWID.svg 850 × 600; 17 KB
-
 Causes of deaths for children between 5 and 14, OWID.svg 850 × 600; 16 KB
-
 Causes of deaths for people who were 70 years and older, OWID.svg 850 × 600; 18 KB
-
 Causes-of-death-in-USA-vs.-media-coverage.png 4,080 × 3,133; 532 KB
-
 Change in mean female height over 100 years, OWID.svg 850 × 600; 83 KB
-
 Change in mean male height over 100 years, OWID.svg 850 × 600; 77 KB
-
 Child deaths from pneumonia by risk factor, OWID.svg 850 × 600; 27 KB
-
 Child deaths from rotavirus, OWID.svg 850 × 600; 10 KB
-
 Child deaths in 1960 vs. 2017, OWID.svg 850 × 600; 20 KB
-
 Child deaths in the 1st year of life, OWID.svg 850 × 600; 8 KB
-
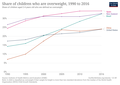
 Child mortality (UN (from 1950)), OWID.svg 850 × 600; 31 KB
-
 Child mortality by income level of country, OWID.svg 850 × 600; 13 KB
-
 Child mortality by sex (World Bank), OWID.svg 850 × 600; 44 KB
-
 Child mortality by sex, OWID.svg 850 × 600; 6 KB
-
 Child mortality by source, OWID.svg 850 × 600; 9 KB
-

-

-

-

-
 Child mortality in Sub-Saharan Africa and Ethiopia.svg 850 × 600; 25 KB
-
 Child mortality in the past vs 2017 (UN IGME), OWID.svg 850 × 600; 25 KB
-
 Child mortality rate Ethiopia.png 1,021 × 645; 33 KB
-
 Child mortality rate in 1990 and 2017 (UN IGME), OWID.svg 850 × 600; 94 KB
-
 Child mortality rate in 2010 and 2017 (UN IGME), OWID.svg 850 × 600; 35 KB
-
 Child mortality rate in Bangladesh.png 1,028 × 644; 34 KB
-

-
 Child mortality rate in China.png 1,029 × 647; 33 KB
-
 Child mortality rate in Haiti.png 1,028 × 646; 37 KB
-
 Child mortality rate in India.png 1,025 × 646; 34 KB
-
 Child mortality rate in Mali.png 1,021 × 651; 34 KB
-
 Child mortality rate in Nigeria.png 1,026 × 648; 33 KB
-
 Child mortality rate in North Korea.png 1,017 × 647; 36 KB
-
 Child mortality rate in Pakistan.png 1,038 × 652; 33 KB
-
 Child mortality rate in South Africa.png 1,029 × 649; 34 KB
-
 Child mortality rate Mexico.png 1,046 × 645; 35 KB
-
 Child mortality rate vs population growth, OWID.svg 850 × 600; 118 KB
-
 Child mortality rate vs. Mean male height, OWID.svg 850 × 600; 37 KB
-

-
 Child mortality rate, 1970 vs 2017 (UN IGME), OWID.svg 850 × 600; 32 KB
-
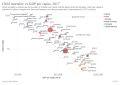 Child mortality vs GDP per capita, OWID.svg 850 × 600; 36 KB
-
 Child mortality vs level of prosperity, OWID.svg 850 × 600; 37 KB
-
 Child mortality vs per capita total health expenditure, OWID.svg 850 × 600; 36 KB
-

-
 Child mortality vs type of political regime, OWID.svg 850 × 600; 33 KB
-
 Child mortality vs. extreme poverty, OWID.svg 850 × 600; 27 KB
-
 Child Mortality vs. Health Expenditure (Gapminder), OWID.svg 850 × 600; 101 KB
-
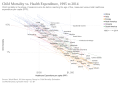
 Child mortality vs. health expenditure, OWID.svg 850 × 600; 40 KB
-
 Child mortality vs. mean years of schooling, OWID.svg 850 × 600; 80 KB
-

-
 Child mortality vs. Prevalence of child wasting, OWID.svg 850 × 600; 22 KB
-
 Child mortality vs. prevalence of teenage pregnancy, OWID.svg 850 × 600; 16 KB
-
 Child mortality vs. Share of children who are anemic, OWID.svg 850 × 600; 43 KB
-

-
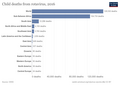
 Child mortality- IHME vs UN IGME estimates, OWID.svg 850 × 600; 37 KB
-
 Child mortality- UN IGME vs UN DESA comparison, OWID.svg 850 × 600; 9 KB
-
 Child-deaths-from-rotavirus.png 3,400 × 2,400; 447 KB
-
 Child-mortality.svg 850 × 600; 35 KB
-

-
 Childhood-deaths-from-the-five-most-lethal-infectious-diseases-worldwide.png 3,400 × 2,400; 430 KB
-
 Children living with HIV, OWID.svg 850 × 600; 9 KB
-
 Children-who-are-overweight.png 3,400 × 2,400; 461 KB
-
 Cholera deaths in Great Britain over the long-term, OWID.svg 850 × 600; 10 KB
-
 Cholera-deaths-in-great-britain.jpg 3,400 × 2,400; 341 KB
-
 Cholera-deaths-in-great-britain.png 3,400 × 2,400; 315 KB
-
 Comparing-the-share-of-men-and-women-who-are-smoking.png 3,302 × 1,873; 483 KB
-

-
 Condom use at last high-risk sex, OWID.svg 850 × 600; 6 KB
-
 Condom use during last high-risk sex by age, OWID.svg 850 × 600; 6 KB
-

-
 Coronavirus-cfr more Countries.svg 850 × 600; 33 KB
-
 Coronavirus-data-explorer.png 3,400 × 2,400; 510 KB
-
 Coronavirus-data-explorer.svg 850 × 600; 37 KB
-
 Covax-donations-per-capita.png 3,400 × 2,400; 453 KB
-
 COVID-19 Stringency Index Laos.svg 850 × 600; 37 KB
-
 COVID-19 vaccine doses administered as of Mar 21, 2021.png 3,400 × 2,400; 547 KB
-
 COVID-19 vaccine doses administered by continent.svg 850 × 600; 107 KB
-
 Covid-confirmed-cases-since-100th-case.svg 850 × 600; 116 KB
-
 Covid-confirmed-daily-cases-epidemiological-trajectory.svg 850 × 600; 122 KB
-
 Cumulative confirmed COVID-19 cases GER 20220112.svg 850 × 600; 50 KB
-
 Cumulative confirmed COVID-19 deaths GER 20220112.svg 850 × 600; 48 KB
-
 Cumulative-covid-vaccine-booster-doses.png 3,400 × 2,400; 422 KB
-
 Current-covid-patients-hospital.png 3,400 × 2,400; 712 KB
-

-

-

-
 Daily new confirmed COVID-19 deaths 20220112.svg 850 × 600; 124 KB
-

-
 Daily new COVID-19 tests GER 20220112 OWID.svg 850 × 600; 47 KB
-
 Daily-covid-19-tests-smoothed-7-day.png 3,400 × 2,400; 520 KB
-
 Daily-smoking-prevalence.png 3,400 × 2,400; 479 KB
-
 DALY rates from alcohol use disorders by age, OWID.svg 850 × 600; 14 KB
-
 DALY rates from anxiety disorders by age, OWID.svg 850 × 600; 17 KB
-
 DALY rates from bipolar disorder by age, OWID.svg 850 × 600; 16 KB
-
 DALY rates from drug use disorders by age, OWID.svg 850 × 600; 17 KB
-
 DALY rates from schizophrenia by age, OWID.svg 850 × 600; 14 KB
-
-
 DALYs from autistic spectrum disorders, OWID.svg 850 × 600; 6 KB
-
 DALYs from eating disorders by age, OWID.svg 850 × 600; 15 KB
-
 DALYs from mental health and substance use disorder by age, OWID.svg 850 × 600; 18 KB
-
 DALYs from mental health and substance use disorders, OWID.svg 850 × 600; 15 KB
-
 Deadliest-animals-01.png 13,114 × 9,225; 1.58 MB
-
 Death rate by age group in England and Wales, OWID.svg 850 × 600; 23 KB
-
 Death rate by cause, OWID.svg 850 × 600; 8 KB
-
 Death rate due to road traffic injuries, OWID.svg 850 × 600; 7 KB
-
 Death rate due to tuberculosis, OWID.svg 850 × 600; 13 KB
-
 Death rate from air pollution (per 100,000), OWID.svg 850 × 600; 9 KB
-
 Death rate from cancer, OWID.svg 850 × 600; 13 KB
-
 Death rate from cancers vs. extreme poverty, OWID.svg 850 × 600; 26 KB
-
 Death rate from cancers vs. GDP per capita, OWID.svg 850 × 600; 35 KB
-
 Death rate from cancers vs. income inequality, OWID.svg 850 × 600; 27 KB
-
 Death rate from indoor air pollution vs. GDP per capita, OWID.svg 850 × 600; 34 KB
-
 Death rate from obesity vs. share of adults who are obese, OWID.svg 850 × 600; 36 KB
-

-
 Death rate from particulate pollution vs GDP per capita, OWID.svg 850 × 600; 36 KB
-
 Death rate from pneumonia vs. GDP per capita, OWID.svg 850 × 600; 35 KB
-
 Death rate from tuberculosis, by age, OWID.svg 850 × 600; 12 KB
-
 Death rates by broad cause category, OWID.svg 850 × 600; 15 KB
-
 Death rates from air pollution, 1, OWID.svg 850 × 600; 11 KB
-
 Death rates from air pollution, OWID.svg 850 × 600; 8 KB
-

-
 Death rates from energy production per TWh (including solar).svg 850 × 600; 27 KB
-
 Death rates from energy production per TWh, OWID.svg 850 × 600; 6 KB
-
 Death rates from energy production per TWh.png 792 × 518; 38 KB
-
 Death rates from energy production, OWID.svg 850 × 600; 10 KB
-

-
 Death rates from low-carbon energy production, OWID.svg 850 × 600; 7 KB
-

-
 Death rates from natural disasters, OWID.svg 850 × 600; 13 KB
-
 Death rates from outdoor air pollution in 1990 vs. 2017, OWID.svg 850 × 600; 38 KB
-
 Death rates from unsafe water vs. GDP per capita, OWID.svg 850 × 600; 35 KB
-
 Death rates through the 20th century, OWID.svg 850 × 600; 14 KB
-
 Death-rate-by-source-from-air-pollution (OWID 0328).png 850 × 600; 56 KB
-

-
 Death-rate-from-pm25-vs-pm25-concentration (OWID 0319).png 850 × 600; 110 KB
-
 Death-rate-indoor-pollution-1990-2017 (OWID 0317).png 850 × 600; 91 KB
-

-

-
 Death-rates-natural-disasters (OWID 0308).png 850 × 600; 62 KB
-
 Deaths by age, OWID.svg 850 × 600; 11 KB
-
 Deaths by cause, OWID.svg 850 × 600; 8 KB
-

-
 Deaths caused by vaccine-preventable diseases, 1, OWID.svg 850 × 600; 8 KB
-
 Deaths caused by vaccine-preventable diseases, OWID.svg 850 × 600; 7 KB
-
 Deaths from cancer, by age, OWID.svg 850 × 600; 11 KB

.png)
.png)


,_OWID.svg)
.png)
.png)


,_OWID.svg)


.png)


,_OWID.svg)


.jpg)


),_OWID.svg)

,_OWID.svg)


,_OWID.svg)


,_OWID.svg)

,_OWID.svg)
,_OWID.svg)


,_OWID.svg)


,_OWID.svg)


_rate_from_alcohol_and_drug_use_disorders,_OWID.svg)


,_OWID.svg)


.svg)


.png)
.png)
.png)
.png)
.png)
.png)
.png)


