Category:Our World in Data - Food and Agriculture
Jump to navigation
Jump to search
Media in category "Our World in Data - Food and Agriculture"
The following 136 files are in this category, out of 136 total.
-
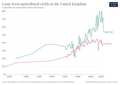 Agri-yields-uk (OWID 0033).png 850 × 600; 66 KB
-
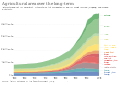 Agricultural area over the long-term, OWID.svg 850 × 600; 31 KB
-
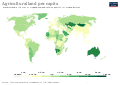
 Agricultural area per capita, OWID.svg 850 × 600; 25 KB
-
 Agricultural export subsidies, OWID.svg 850 × 600; 9 KB
-
 Agricultural general services support, OWID.svg 850 × 600; 139 KB
-
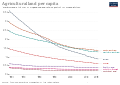
 Agricultural land use per person, OWID.svg 850 × 600; 15 KB
-
 Agricultural producer support, OWID.svg 850 × 600; 140 KB
-
 Agricultural water as a share of total water withdrawals, OWID.svg 850 × 600; 140 KB
-
 Agricultural water withdrawals vs. GDP per capita, OWID.svg 850 × 600; 13 KB
-
 Agricultural water withdrawals, OWID.svg 850 × 600; 141 KB
-
 Agricultural yields in key crops per hectare, 1961-2014, OWID.svg 850 × 600; 31 KB
-
 Agricultural-area-per-capita (1).svg 850 × 600; 169 KB
-
 Agricultural-area-per-capita.svg 850 × 600; 55 KB
-
 Agricultural-export-subsidies.png 3,400 × 2,400; 456 KB
-
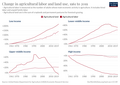 Agricultural-labor-land (OWID 0030).png 850 × 600; 91 KB
-
 Agricultural-land (OWID 0024).png 850 × 600; 97 KB
-
 Agricultural-land-area-by-farm-size (OWID 0029).png 850 × 600; 73 KB
-
 Agricultural-land-irrigation (OWID 0023).png 850 × 600; 107 KB
-
 Agricultural-output-dollars (OWID 0026).png 850 × 600; 51 KB
-
 Agricultural-water-withdrawals-vs-gdp-per-capita (OWID 0025).png 850 × 600; 117 KB
-
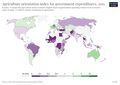
 Agriculture orientation index for government expenditures, OWID.svg 850 × 600; 140 KB
-
 Agriculture value added per worker vs. GDP per capita, OWID.svg 850 × 600; 181 KB
-
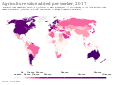 Agriculture value added per worker, OWID.svg 850 × 600; 141 KB
-
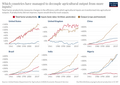 Agriculture-decoupling-productivity (OWID 0021).png 850 × 600; 118 KB
-
 Agriculture-land-fao (OWID 0020).png 850 × 600; 38 KB
-
 Agriculture-more-less-land (OWID 0019).png 850 × 600; 103 KB
-
 Agriculture-orientation-index (OWID 0018).png 850 × 600; 102 KB
-
 Agriculture-orientation-index.png 3,400 × 2,400; 831 KB
-
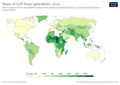 Agriculture-share-gdp (OWID 0017).png 850 × 600; 99 KB
-
 Agriculture-value-added-per-worker-vs-gdp-per-capita (OWID 0016).png 850 × 600; 91 KB
-
 Agriculture-value-added-per-worker-wdi.png 3,400 × 2,400; 885 KB
-
 Animal-protein-consumption (OWID 0070).png 850 × 600; 73 KB
-
 Animals-slaughtered-for-meat (OWID 0068).png 850 × 600; 58 KB
-
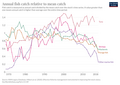 Annual-fish-catch-taxa (OWID 0043).png 850 × 600; 106 KB
-
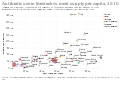 Antibiotic use in livestock vs. meat supply per capita, OWID.svg 850 × 600; 30 KB
-
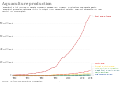 Aquaculture production, OWID.svg 850 × 600; 27 KB
-

-

-
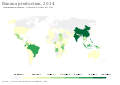
 Banana production by region, OWID.svg 850 × 600; 41 KB
-
 Banana production, OWID.svg 850 × 600; 140 KB
-
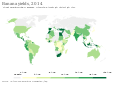 Banana yields, OWID.svg 850 × 600; 140 KB
-
 Beef and buffalo meat consumption per person, OWID.svg 850 × 600; 23 KB
-
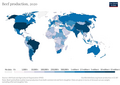
 Beef meat production, OWID.svg 850 × 600; 141 KB
-
 Beef-and-buffalo-meat-production-tonnes (OWID 0080).png 850 × 600; 105 KB
-
 Beer as a share of total alcohol consumption, OWID.svg 850 × 600; 139 KB
-
 Beer consumption per person, OWID.svg 850 × 600; 141 KB
-
 Beer-as-share-alcohol-consumption.png 3,400 × 2,400; 752 KB
-
 Capture-and-aquaculture-production (OWID 0132).png 850 × 600; 60 KB
-
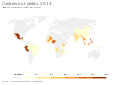 Cashew nut yields, OWID.svg 850 × 600; 147 KB
-
 Cattle meat per animal, OWID.svg 850 × 600; 140 KB
-
 Cattle-livestock-count-heads (OWID 0116).png 850 × 600; 95 KB
-
 Cattle-meat-yields-hectograms-100-grams-per-animal (OWID 0115).png 850 × 600; 93 KB
-
 Cereal crop yield vs. fertilizer application, OWID.svg 850 × 600; 37 KB
-
 Cereal distribution to food, animal feed and other uses, OWID.svg 850 × 600; 14 KB
-
 Cereal production, yield and land use, OWID.svg 850 × 600; 15 KB
-
 Cereal yield vs. GDP per capita, OWID.svg 850 × 600; 41 KB
-
 Cereal yield, OWID.svg 850 × 600; 140 KB
-
 Cereal yields vs. GDP per capita, OWID.svg 850 × 600; 40 KB
-
 Cereal yields vs. tractor inputs in agriculture, OWID.svg 850 × 600; 202 KB
-
 Cereal-crop-yield-vs-fertilizer-application (OWID 0112).png 850 × 600; 84 KB
-
 Cereal-distribution-to-uses (OWID 0113).png 850 × 600; 63 KB
-
 Cereal-land-spared (OWID 0114).png 850 × 600; 58 KB
-
 Cereal-production (OWID 0111).png 850 × 600; 103 KB
-
 Cereal-yield-vs-extreme-poverty (OWID 0109).png 850 × 600; 74 KB
-
 Cereal-yield-vs-extreme-poverty-scatter (OWID 0110).png 850 × 600; 117 KB
-
 Cereal-yield-vs-gdp-per-capita (OWID 0108).png 850 × 600; 92 KB
-
 Cereal-yields-uk (OWID 0170).png 850 × 600; 110 KB
-
 Cereal-yields-vs-gdp-per-capita (OWID 0171).png 850 × 600; 82 KB
-
 Cereal-yields-vs-tractor-inputs-in-agriculture (OWID 0169).png 850 × 600; 121 KB
-
 Cereals allocated to food, animal feed and fuel, World.png 3,400 × 2,400; 316 KB
-
 Cereals-human-food-vs-gdp (OWID 0167).png 850 × 600; 120 KB
-
 Cereals-imports-vs-exports (OWID 0168).png 850 × 600; 106 KB
-
 Change-calories-climate-yield (OWID 0166).png 850 × 600; 107 KB
-
 Change-in-production-yield-and-land-palm (OWID 0156).png 850 × 600; 58 KB
-
 Change-of-cereal-yield-vs-land-used (OWID 0155).png 850 × 600; 69 KB
-
 Chicken meat production, OWID.svg 850 × 600; 140 KB
-
 Chicken meat yields per animal, OWID.svg 850 × 600; 139 KB
-
 Cocoa bean production, OWID.svg 850 × 600; 139 KB
-
 Cocoa bean yields, OWID.svg 850 × 600; 142 KB
-
 Cocoa beans production by region, OWID.svg 850 × 600; 22 KB
-
 Coffee bean production, OWID.svg 850 × 600; 140 KB
-
 Coffee bean yields, OWID.svg 850 × 600; 140 KB
-
 Coffee production by region, OWID.svg 850 × 600; 28 KB
-

-
 Crop yields of cereals and pulses, OWID.svg 850 × 600; 13 KB
-
 Crop-allocation-farm-size (OWID 0229).png 850 × 600; 88 KB
-
 Cropland extent over the long-run, OWID.svg 850 × 600; 33 KB
-
 Cropland per capita vs. population density, OWID.svg 850 × 600; 15 KB
-
 Cropland per capita, OWID.svg 850 × 600; 15 KB
-
 Cropland per person over the long-term, OWID.svg 850 × 600; 14 KB
-
 Cropland use over the long-term, OWID.svg 850 × 600; 32 KB
-
 Cropland-pasture-per-person (OWID 0232).png 850 × 600; 53 KB
-

-
 Daily caloric supply per person vs. GDP per capita, OWID.svg 850 × 600; 32 KB
-
 Daily hempseed production, OWID.svg 850 × 600; 20 KB
-
 Daily meat consumption per person, OWID.svg 850 × 600; 139 KB
-
 Daily meat consumption per person.svg 850 × 600; 163 KB
-
 Daily per capita caloric supply, OWID.svg 850 × 600; 142 KB
-
 Daily per capita fat supply vs. GDP per capita, OWID.svg 850 × 600; 186 KB
-
 Daily per capita fat supply, OWID.svg 850 × 600; 141 KB
-
 Daily per capita protein supply vs. GDP per capita, OWID.svg 850 × 600; 33 KB
-
 Daily per capita protein supply, OWID.svg 850 × 600; 143 KB
-
 Daily per capita supply of calories vs. GDP per capita, OWID.svg 850 × 600; 33 KB
-
 Daily per capita supply of calories, OWID.svg 850 × 600; 19 KB
-
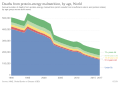
 Daily per-capita food energy supply of countries.svg 850 × 600; 62 KB
-
 Daily per-capita food energy supply of regions.svg 850 × 600; 68 KB
-

-
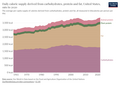
 Daily protein supply from animal and plant-based foods, OWID.svg 850 × 600; 8 KB
-
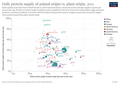
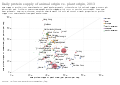 Daily protein supply of animal origin vs. plant origin, OWID.svg 850 × 600; 36 KB
-
 Daily protein supply per capita vs. GDP per capita, OWID.svg 850 × 600; 185 KB
-
 Daily-caloric-supply-derived-from-carbohydrates-protein-and-fat.png 3,400 × 2,400; 468 KB
-
 Daily-per-capita-caloric-supply-countries.svg 850 × 600; 62 KB
-
 Daily-per-capita-protein-supply-vs-gdp-per-capita (OWID 0209).png 850 × 600; 103 KB
-
 Daily-protein-supply-of-animal-origin-vs-plant-origin (OWID 0206).png 850 × 600; 110 KB
-
 Daily-protein-supply-per-capita-vs-gdp-per-capita (OWID 0204).png 850 × 600; 215 KB
-
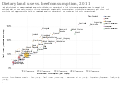
 Deaths from protein-energy malnutrition, by age, OWID.svg 850 × 600; 12 KB
-
 Dietary land use vs. beef consumption, OWID.svg 850 × 600; 34 KB
-
 Does livestock antibiotic use exceed suggested target., OWID.svg 850 × 600; 139 KB
-
 Eat-lancet-diet-animal-products (OWID 0274).png 850 × 600; 85 KB
-
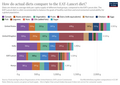 Eat-lancet-diet-comparison (OWID 0275).png 850 × 600; 92 KB
-
 Egg production, OWID.svg 850 × 600; 142 KB
-
 Eggs per bird, OWID.svg 850 × 600; 141 KB
-
 Environmental-footprint-milks (OWID 0348).png 850 × 600; 83 KB
-
 Environmental-impact-of-food-by-life-cycle-stage.png 2,933 × 2,635; 453 KB
-
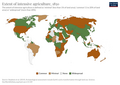
 Extent-of-extensive-agriculture (OWID 0333).png 850 × 600; 105 KB
-
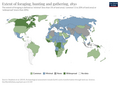 Extent-of-foraging (OWID 0335).png 850 × 600; 104 KB
-
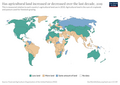
 Extent-of-intensive-agriculture (OWID 0331).png 850 × 600; 104 KB
-
 Extent-of-pastoralism (OWID 0332).png 850 × 600; 103 KB
-
 Extent-of-urbanization (OWID 0334).png 850 × 600; 90 KB
-
 Fish-catch-gear-type (OWID 0440).png 850 × 600; 89 KB
-
 Food-emissions-life-cycle (OWID 0425).png 850 × 600; 90 KB
-
 Global fishery catch by sector, OWID.svg 850 × 600; 16 KB
-
 Global meat production.svg 850 × 600; 39 KB
-
 Global-meat-production (OWID 0536).png 850 × 600; 62 KB
-
 Global-meat-production-by-livestock-type (OWID 0537).png 850 × 600; 79 KB
-
 Global-meat-projections-to-2050 (OWID 0533).png 850 × 600; 72 KB
.png)


.svg)


.png)
.png)
.png)
.png)
.png)
.png)


.png)
.png)
.png)
.png)

.png)
.png)

.png)
.png)
.png)


.png)


.png)


.png)
.png)


.png)
.png)
.png)
.png)
.png)
.png)
.png)
.png)
.png)
.png)

.png)
.png)
.png)
.png)
.png)


.png)


.png)


.png)
.png)
.png)


.png)
.png)


.png)

.png)
.png)
.png)
.png)
.png)
.png)
.png)


.png)
.png)
.png)