File:Relative humidity distributions within thin cirrus for several regions and inter-annual variations in the Indian Ocean (8385560948).jpg
Original file (500 × 813 pixels, file size: 100 KB, MIME type: image/jpeg)
Captions
Captions
Summary[edit]
.jpg&action=edit§ion=1)
| Description |
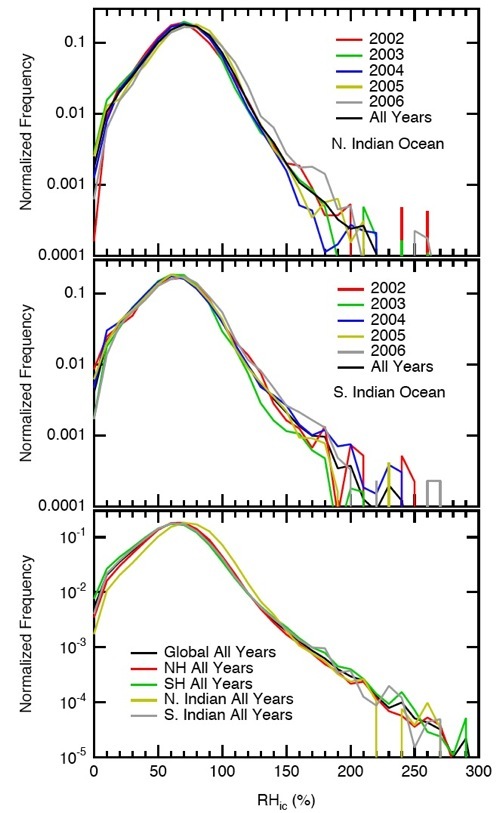
English: These sub-panels show differences in the characteristics of RHic histograms within thin cirrus clouds for different regions and time periods. (A) Normalized RHic distributions over the N. Indian Ocean and partitioned by year (2002-2006). (B) same as (A) except for the S. Indian Ocean. (C) Normalized RHic distributions for the tropical ocean average (±20 latitude) and for four sub-regions: the NH, SH, and N. and S. Indian Oceans. These histograms show that the variability from year to year is somewhat higher in the N. Indian Ocean versus the S. Indian Ocean, even though the total counts in the histograms are very similar. Furthermore, they also show that the North Indian Ocean tends to have 5-10% higher RHic compared to other regions. Whether this is caused by anthropogenic activity (e.g., aerosols) or controlled by the dynamics of the South Asian monsoon, or another cause is yet to be determined.
______________________________________________________________________ About AIRS The Atmospheric Infrared Sounder, AIRS, in conjunction with the Advanced Microwave Sounding Unit, AMSU, sense emitted infrared and microwave radiation from the Earth to provide a three-dimensional look at Earth's weather and climate. Working in tandem, the two instruments make simultaneous observations all the way down to the Earth's surface, even in the presence of heavy clouds. With more than 2,000 channels sensing different regions of the atmosphere, the system creates a global, 3-dimensional map of atmospheric temperature and humidity, cloud amounts and heights, greenhouse gas concentrations, and many other atmospheric phenomena. The AIRS and AMSU fly onboard NASA's Aqua spacecraft and are managed by the Jet Propulsion Laboratory, Pasadena, California, under contract to NASA. JPL is a division of the California Institute of Technology in Pasadena. Credit NASA/JPL AIRS Project Download the image Various sizes of the image are available, and there are two ways to download: 1) Right-click on the image. Click on a size next to "View all sizes". 2) Click on the "Actions" menu located above the image. Select "View all sizes". Resources Atmospheric Infrared Sounder web site How to get the AIRS data Data Products Data Portals Documentation |
| Date | Taken on 15 January 2013, 17:21:37 |
| Source | Relative humidity distributions within thin cirrus for several regions and inter-annual variations in the Indian Ocean |
| Author | Atmospheric Infrared Sounder |
| Flickr set | Clouds |
| Flickr tags | atmosphericinfraredsounder; nasa; airs; jpl; clouds |
Licensing[edit]
.jpg&action=edit§ion=2)
- You are free:
- to share – to copy, distribute and transmit the work
- to remix – to adapt the work
- Under the following conditions:
- attribution – You must give appropriate credit, provide a link to the license, and indicate if changes were made. You may do so in any reasonable manner, but not in any way that suggests the licensor endorses you or your use.
| This image was originally posted to Flickr by Atmospheric Infrared Sounder at https://flickr.com/photos/90896682@N06/8385560948. It was reviewed on 7 October 2023 by FlickreviewR 2 and was confirmed to be licensed under the terms of the cc-by-2.0. |
| This file is in the public domain in the United States because it was solely created by NASA. NASA copyright policy states that "NASA material is not protected by copyright unless noted". (See Template:PD-USGov, NASA copyright policy page or JPL Image Use Policy.) | ||
 |
Warnings:
|
File history
Click on a date/time to view the file as it appeared at that time.
| Date/Time | Thumbnail | Dimensions | User | Comment | |
|---|---|---|---|---|---|
| current | 19:33, 7 October 2023 | | 500 × 813 (100 KB) | OptimusPrimeBot (talk | contribs) | #Spacemedia - Upload of https://live.staticflickr.com/8518/8385560948_7d8ebedc5d_o.jpg via Commons:Spacemedia |
You cannot overwrite this file.
File usage on Commons
There are no pages that use this file.
.jpg&oldid=853443684)