File:Mean of sample vs size of sample.svg
Jump to navigation
Jump to search

Size of this PNG preview of this SVG file: 759 × 407 pixels. Other resolutions: 320 × 172 pixels | 640 × 343 pixels | 1,024 × 549 pixels | 1,280 × 686 pixels | 2,560 × 1,373 pixels.
Original file (SVG file, nominally 759 × 407 pixels, file size: 58 KB)
Captions
Captions
Law of large numbers
Summary[edit]
| Description |
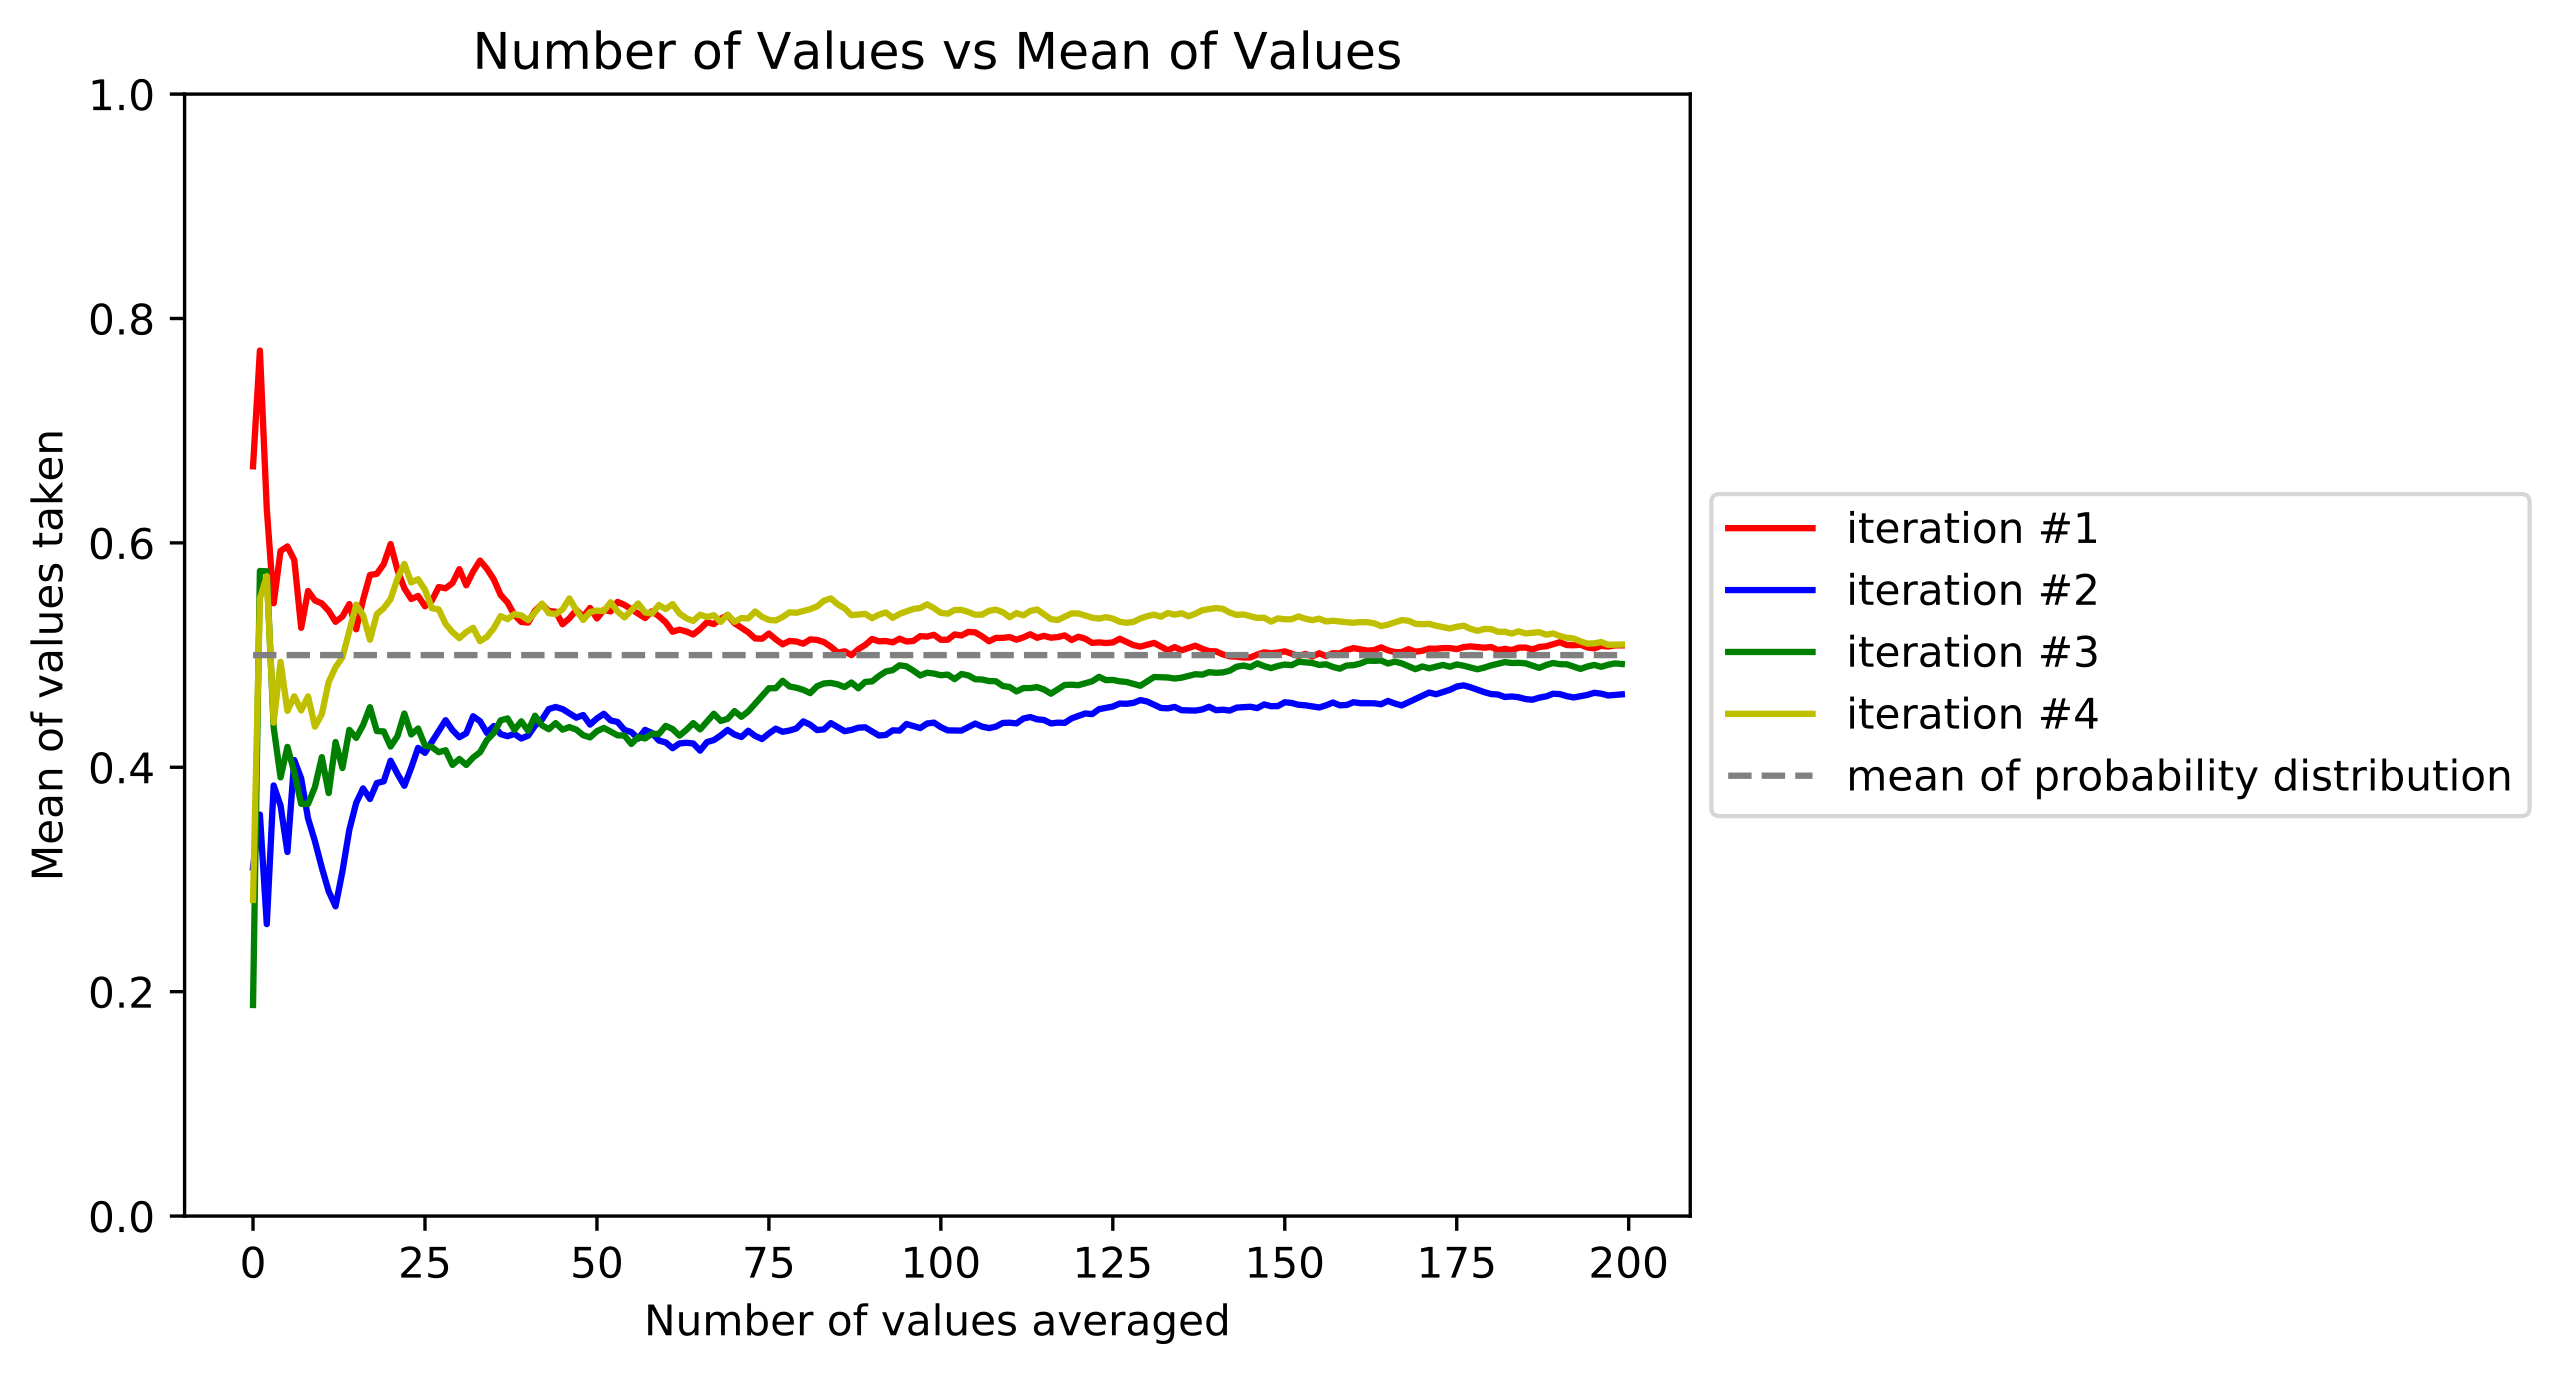
English: As the size of a sample of numbers increases, the mean of those numbers tends toward the mean of the distribution that the sample is drawn from.
Inspired by: https://commons.wikimedia.org/w/index.php?title=Special:UserLogin&returnto=File%3ALawoflargenumbers.svg |
| Date | |
| Source | Own work |
| Author | DLohmann |
Licensing[edit]
I, the copyright holder of this work, hereby publish it under the following license:
This file is licensed under the Creative Commons Attribution-Share Alike 4.0 International license.
- You are free:
- to share – to copy, distribute and transmit the work
- to remix – to adapt the work
- Under the following conditions:
- attribution – You must give appropriate credit, provide a link to the license, and indicate if changes were made. You may do so in any reasonable manner, but not in any way that suggests the licensor endorses you or your use.
- share alike – If you remix, transform, or build upon the material, you must distribute your contributions under the same or compatible license as the original.
Source code[edit]
The Python code for this plot
from random import random, seed
from matplotlib import pyplot as plt

# Run random trials random uniformly distributed from 0 to 1
N = 200
x = [i for i in range(N)]
colors = ['r', 'b', 'g', 'y']#, 'c-', 'm-', 'k-']
fig = plt.figure(1)
ax = fig.add_subplot(111)
ax.set_ylim((0, 1))
for color_index, color in enumerate(colors):
  y = [random() for i in range(N)]
  total = [sum(y[0:i])/(i) for i in range(1, N+1)]
  ax.plot(x, total, color=color, label=str('iteration #' + str(color_index+1)))


ax.plot([0, N-1], [0.5, 0.5], 'gray', linestyle='--', label='mean of probability distribution')
handles, labels = ax.get_legend_handles_labels()
legend = ax.legend(handles=handles, labels=labels, loc='center left', bbox_to_anchor=(1, 0.5))
ax.set_title("Number of Values vs Mean of Values")
ax.set_ylabel("Mean of values taken")
ax.set_xlabel("Number of values averaged")
fig.savefig('Mean of sample vs size of sample.svg', bbox_extra_artists=(legend,), bbox_inches='tight')
plt.show()
File history
Click on a date/time to view the file as it appeared at that time.
| Date/Time | Thumbnail | Dimensions | User | Comment | |
|---|---|---|---|---|---|
| current | 08:12, 17 December 2019 | | 759 × 407 (58 KB) | DLohmann (talk | contribs) | User created page with UploadWizard |
You cannot overwrite this file.
File usage on Commons
There are no pages that use this file.