File:Industrialization per capita 1750-1900.svg
Jump to navigation
Jump to search

Size of this PNG preview of this SVG file: 484 × 350 pixels. Other resolutions: 320 × 231 pixels | 640 × 463 pixels | 1,024 × 740 pixels | 1,280 × 926 pixels | 2,560 × 1,851 pixels.
Original file (SVG file, nominally 484 × 350 pixels, file size: 50 KB)
Captions
Captions
Add a one-line explanation of what this file represents
Summary[edit]
| Description |
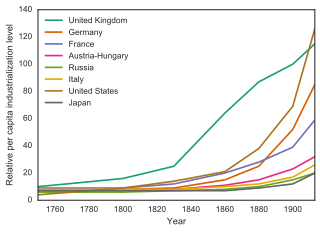
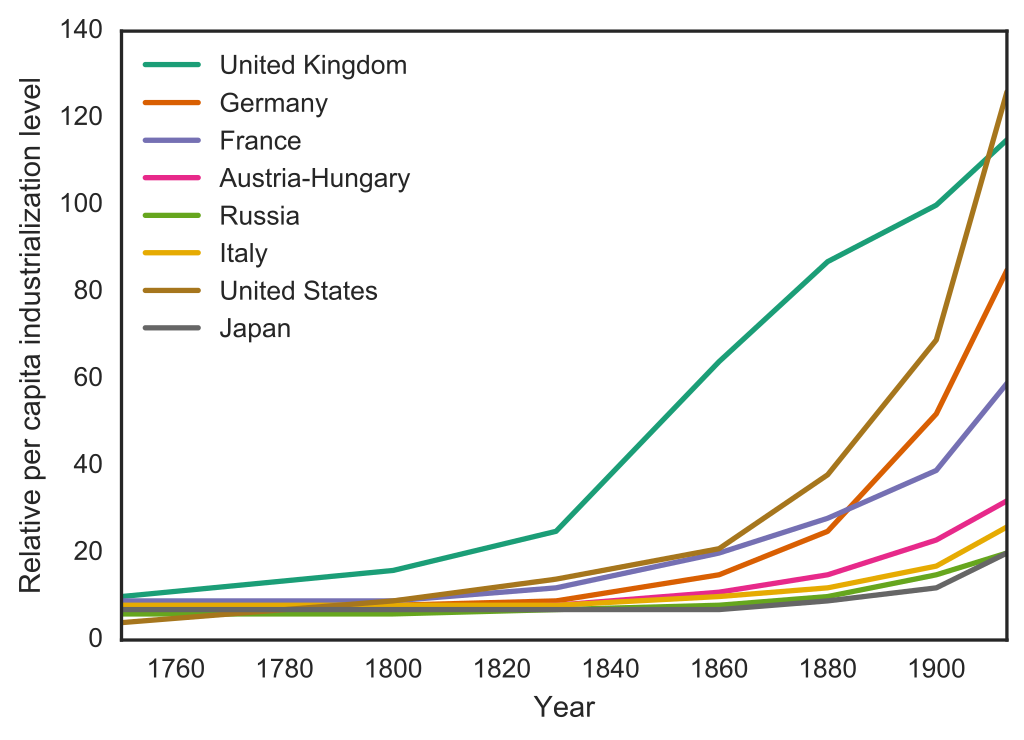
English: Relative per capita levels of industrialization in developed countries. United Kingdom has the value of 100 at 1900. Values are triennial annual averages, except for 1913.
|
| Date | |
| Source | Own work |
| Author | Nicoguaro |
| SVG development | This plot was created with Matplotlib. |
| Source code | Python code"""
Data from Paul Bairoch, "International Industrialization Levels from 1750 to 1980," Journal of European Economic History (1982) v. 11.
"""
import numpy as np
import seaborn as sns
import matplotlib.pyplot as plt
palette_colors = ["#1b9e77", "#d95f02", "#7570b3", "#e7298a", "#66a61e",
"#e6ab02", "#a6761d", "#666666"]
palette = sns.color_palette(palette_colors, 8)
sns.set_style("white")
years = [1750, 1800, 1830, 1860, 1880, 1900, 1913]
countries = ["United Kingdom", "Germany", "France", "Austria-Hungary",
"Russia", "Italy", "United States", "Japan"]
data = np.array([
[ 10., 16., 25., 64., 87., 100., 115.],
[ 8., 8., 9., 15., 25., 52., 85.],
[ 9., 9., 12., 20., 28., 39., 59.],
[ 7., 7., 8., 11., 15., 23., 32.],
[ 6., 6., 7., 8., 10., 15., 20.],
[ 8., 8., 8., 10., 12., 17., 26.],
[ 4., 9., 14., 21., 38., 69., 126.],
[ 7., 7., 7., 7., 9., 12., 20.]])
plt.figure(figsize=(6, 4))
for k in range(8):
plt.plot(years, data[k, :], lw=2, color=palette[k], label=countries[k])
plt.legend(loc="best")
plt.xlabel("Year")
plt.ylabel("Relative per capita industrialization level")
plt.xlim([1750, 1913])
plt.savefig("Industrialization_per_capita_1750-1900.svg", bbox_inches="tight")
plt.show()
|
Licensing[edit]
I, the copyright holder of this work, hereby publish it under the following license:
This file is licensed under the Creative Commons Attribution 4.0 International license.
- You are free:
- to share – to copy, distribute and transmit the work
- to remix – to adapt the work
- Under the following conditions:
- attribution – You must give appropriate credit, provide a link to the license, and indicate if changes were made. You may do so in any reasonable manner, but not in any way that suggests the licensor endorses you or your use.
File history
Click on a date/time to view the file as it appeared at that time.
| Date/Time | Thumbnail | Dimensions | User | Comment | |
|---|---|---|---|---|---|
| current | 17:31, 4 July 2016 | | 484 × 350 (50 KB) | Nicoguaro (talk | contribs) | Add axis labels. |
| 21:56, 21 June 2016 |  | 540 × 360 (46 KB) | Nicoguaro (talk | contribs) | User created page with UploadWizard |
You cannot overwrite this file.
File usage on Commons
There are no pages that use this file.
File usage on other wikis
The following other wikis use this file:
- Usage on ar.wikipedia.org
- Usage on en.wikipedia.org
- Usage on nl.wikibooks.org