File:Complex systems organizational map.jpg
Jump to navigation
Jump to search
Size of this preview: 599 × 600 pixels. Other resolutions: 240 × 240 pixels | 480 × 480 pixels | 767 × 768 pixels | 1,142 × 1,143 pixels.
Original file (1,142 × 1,143 pixels, file size: 205 KB, MIME type: image/jpeg)
Captions
Captions
Game Theory in contexts
Summary[edit]
| Description |
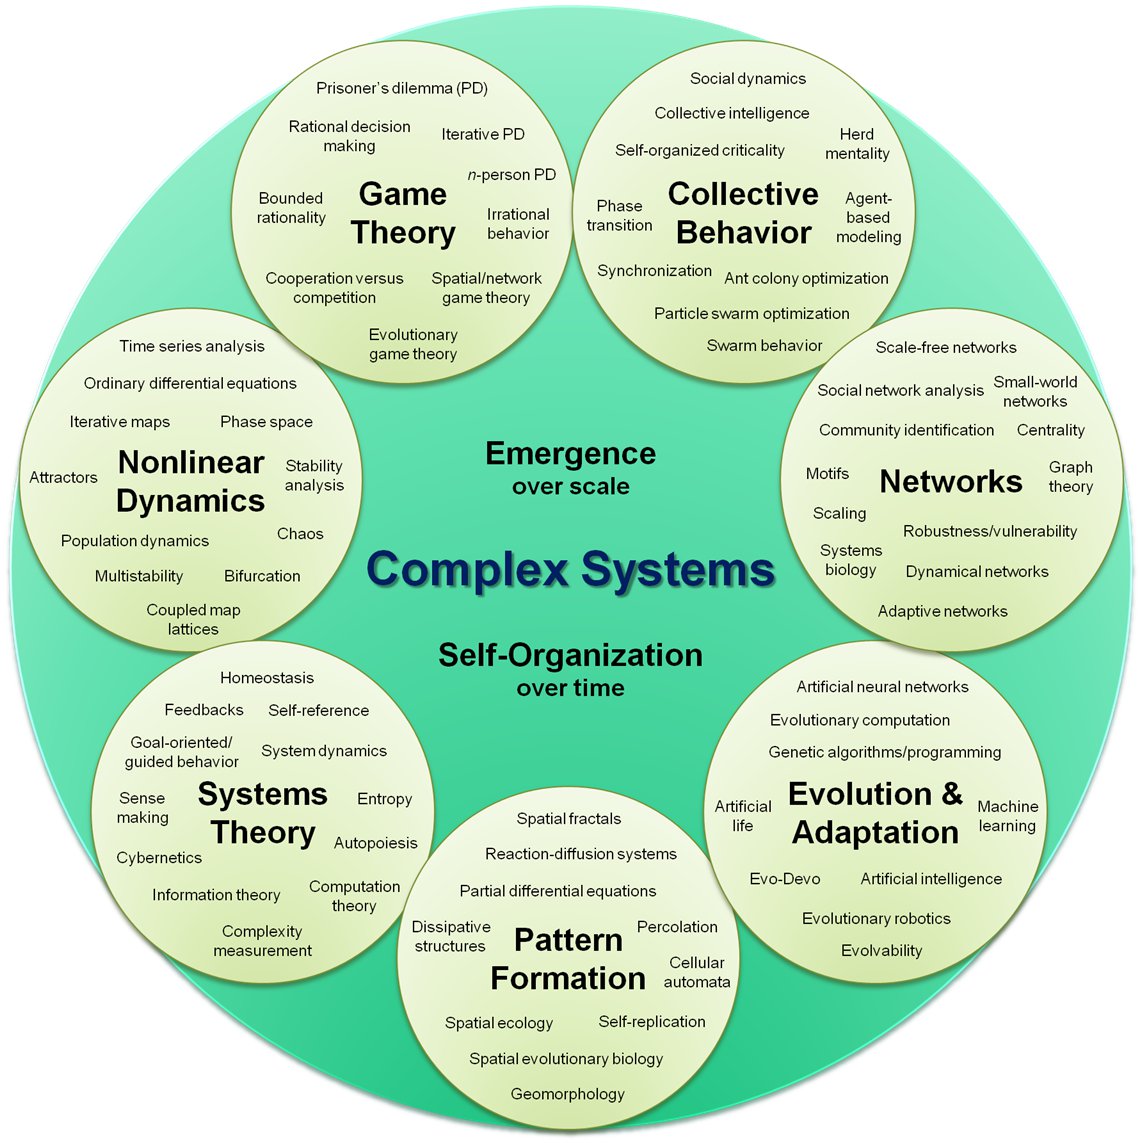
English: This is a visual, organizational map of complex systems broken into seven sub-groups. |
| Date | |
| Source | Created by Hiroki Sayama, D.Sc., Collective Dynamics of Complex Systems (CoCo) Research Group at Binghamton University, State University of New York |
| Author | Hiroki Sayama, D.Sc. |
| Permission (Reusing this file) |

|
This diagram image could be re-created using vector graphics as an SVG file. This has several advantages; see Commons:Media for cleanup for more information. If an SVG form of this image is available, please upload it and afterwards replace this template with
{{vector version available|new image name}}.
It is recommended to name the SVG file “Complex systems organizational map.svg”—then the template Vector version available (or Vva) does not need the new image name parameter. |


|
File:Complex systems organizational map.svg is a vector version of this file. It should be used in place of this JPG file when not inferior.
File:Complex systems organizational map.jpg → File:Complex systems organizational map.svg
For more information, see Help:SVG. |
 |
Licensing[edit]
This file is licensed under the Creative Commons Attribution-Share Alike 3.0 Unported license.
- You are free:
- to share – to copy, distribute and transmit the work
- to remix – to adapt the work
- Under the following conditions:
- attribution – You must give appropriate credit, provide a link to the license, and indicate if changes were made. You may do so in any reasonable manner, but not in any way that suggests the licensor endorses you or your use.
- share alike – If you remix, transform, or build upon the material, you must distribute your contributions under the same or compatible license as the original.
File history
Click on a date/time to view the file as it appeared at that time.
| Date/Time | Thumbnail | Dimensions | User | Comment | |
|---|---|---|---|---|---|
| current | 04:19, 1 December 2010 | | 1,142 × 1,143 (205 KB) | SwarmIntelligence (talk | contribs) | {{Information |Description={{en|1=This is a visual, organizational map of complex systems broken into six sub-groups.}} |Source=Created by Hiroki Sayama, D.Sc., Collective Dynamics of Complex Systems (CoCo) Research Group at Binghamton University, State U |
You cannot overwrite this file.
File usage on Commons
The following 3 pages use this file:
File usage on other wikis
The following other wikis use this file:
- Usage on ar.wikipedia.org
- Usage on bn.wikipedia.org
- Usage on bs.wikipedia.org
- Usage on en.wikipedia.org
- Usage on en.wikiquote.org
- Usage on fa.wikipedia.org
- Usage on it.wikipedia.org
- Usage on ja.wikipedia.org
- Usage on no.wikipedia.org
- Usage on uk.wikipedia.org
- Usage on www.wikidata.org
- Usage on zh.wikipedia.org