File:Characterization of the SOX2T-positive territory of the epiblast in chicken embryo.jpg
Original file (2,113 × 1,581 pixels, file size: 1.21 MB, MIME type: image/jpeg)
Captions
Captions
Summary[edit]
| Description |
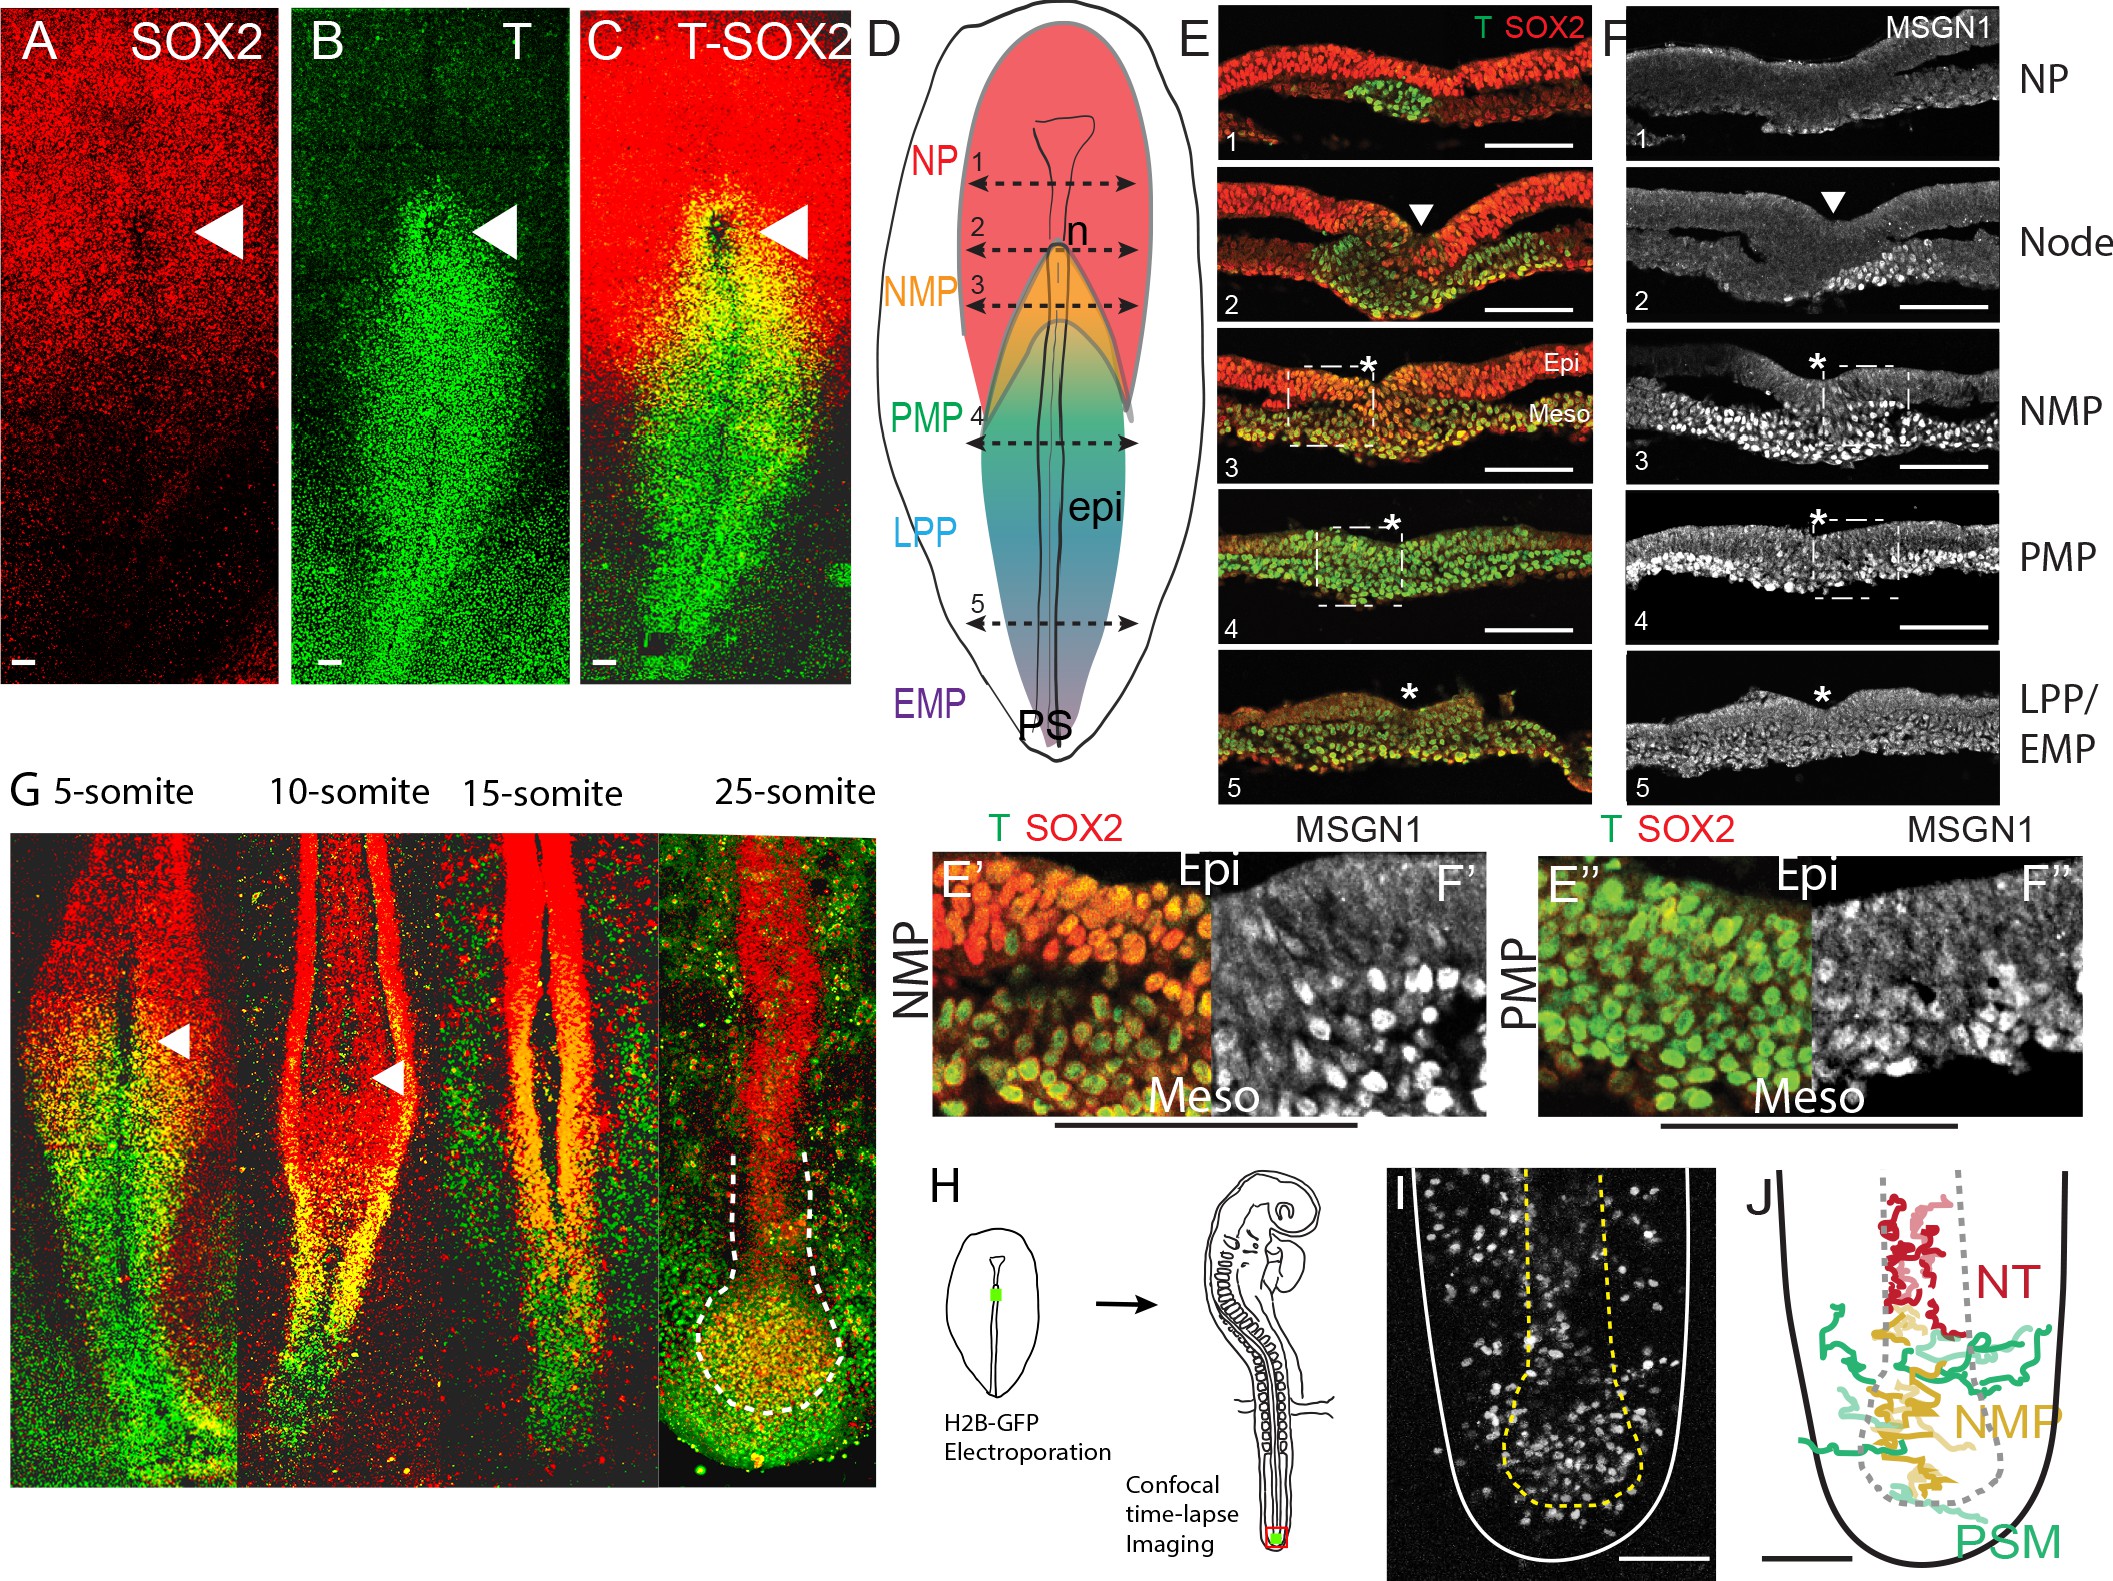
Fig. 1. Characterization of the SOX2/T-positive territory of the epiblast. |
| Date | |
| Source |
https://iiif.elifesciences.org/lax/64819%2Felife-64819-fig1-v2.tif/full/1500,/0/default.jpg https://doi.org/10.7554/eLife.64819 Dynamics of primitive streak regression controls the fate of neuromesodermal progenitors in the chicken embryo eLife 10:e64819. |
| Author | Charlene Guillot Yannis Djeffal Arthur Michaut Brian Rabe Olivier Pourquié |

|
This file, which was originally posted to an external website, has not yet been reviewed by an administrator or reviewer to confirm that the above license is valid. See Category:License review needed for further instructions.
|
Copyright
© 2021, Guillot et al.
This article is distributed under the terms of the Creative Commons Attribution License, which permits unrestricted use and redistribution provided that the original author and source are credited.
Licensing[edit]
- You are free:
- to share – to copy, distribute and transmit the work
- to remix – to adapt the work
- Under the following conditions:
- attribution – You must give appropriate credit, provide a link to the license, and indicate if changes were made. You may do so in any reasonable manner, but not in any way that suggests the licensor endorses you or your use.
File history
Click on a date/time to view the file as it appeared at that time.
| Date/Time | Thumbnail | Dimensions | User | Comment | |
|---|---|---|---|---|---|
| current | 20:32, 1 May 2024 | | 2,113 × 1,581 (1.21 MB) | Rasbak (talk | contribs) | {{Information |description= Fig. 1. Characterization of the SOX2/T-positive territory of the epiblast.<br> (A–C) Whole-mount embryos and (E, F) transverse cryosections showing the immunolocalization of SOX2 (A), T (B), T and SOX2 (C, E), and MSGN1 (F) in chicken embryos at stage 5HH. (D) Schematic representation of the expression of T (blue: high; green: low), SOX2 (red), and SOX2/T (gold) in a stage 5HH chicken embryo. The level of the tissue sections in (E, F) is shown with dashed double ar... |
You cannot overwrite this file.
File usage on Commons
There are no pages that use this file.
File usage on other wikis
The following other wikis use this file:
- Usage on nl.wikipedia.org