File:Change in Urban Population and Motorisation Rate.png
Jump to navigation
Jump to search

Size of this preview: 576 × 600 pixels. Other resolutions: 231 × 240 pixels | 461 × 480 pixels | 738 × 768 pixels | 984 × 1,024 pixels | 1,967 × 2,048 pixels | 3,995 × 4,159 pixels.
Original file (3,995 × 4,159 pixels, file size: 8.77 MB, MIME type: image/png)
Captions
Captions
Change in Urban Population and Motorisation Rate
Summary[edit]
| Description |
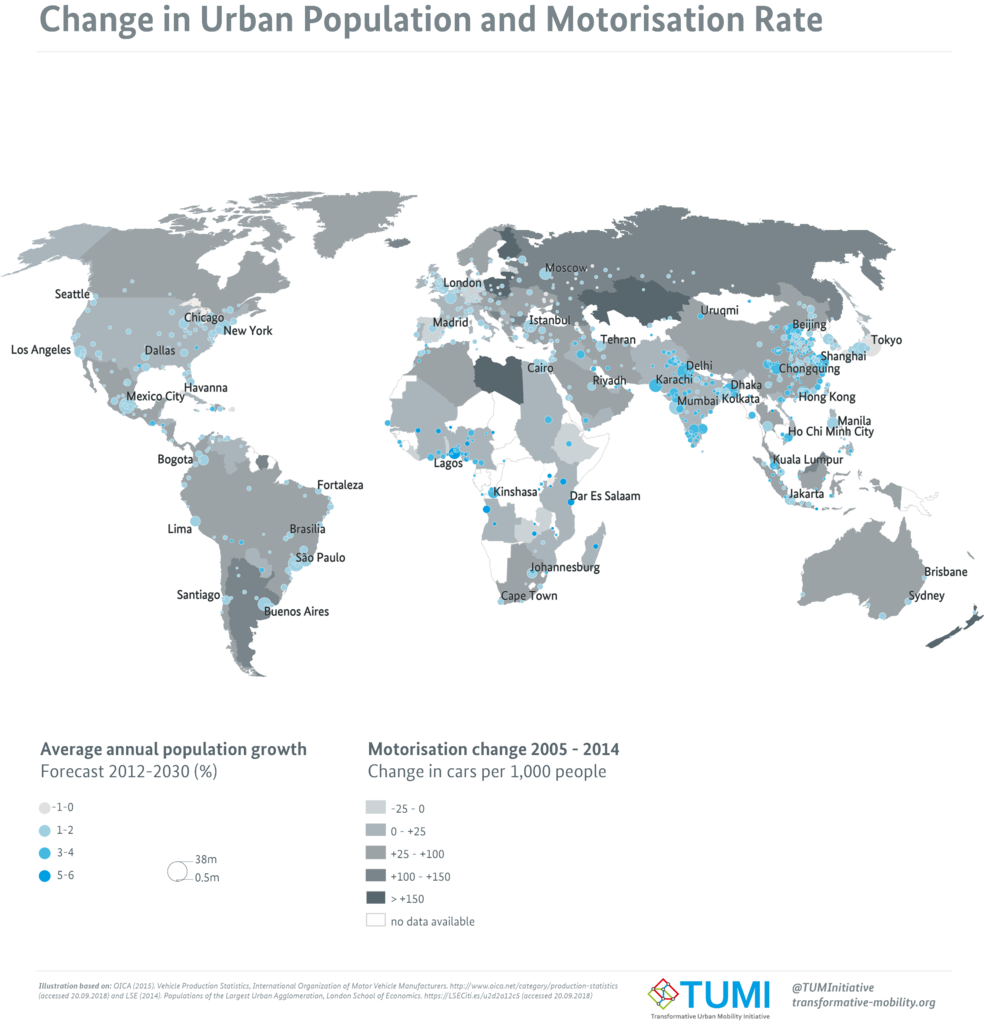
English: Change in Urban Population and Motorisation Rate
Average annual population growth, Forecast 2012-2030 (%) Motorisation change 2005-2014, Change in cars per 1000 people |
| Date | |
| Source | Own work |
| Author | Transformative Urban Mobility Initiative (TUMI) |
| Permission (Reusing this file) |
Licensing[edit]
I, the copyright holder of this work, hereby publish it under the following license:
This file is licensed under the Creative Commons Attribution-Share Alike 4.0 International license.
- You are free:
- to share – to copy, distribute and transmit the work
- to remix – to adapt the work
- Under the following conditions:
- attribution – You must give appropriate credit, provide a link to the license, and indicate if changes were made. You may do so in any reasonable manner, but not in any way that suggests the licensor endorses you or your use.
- share alike – If you remix, transform, or build upon the material, you must distribute your contributions under the same or compatible license as the original.
File history
Click on a date/time to view the file as it appeared at that time.
| Date/Time | Thumbnail | Dimensions | User | Comment | |
|---|---|---|---|---|---|
| current | 13:20, 6 June 2019 | | 3,995 × 4,159 (8.77 MB) | Sophiaforgiz (talk | contribs) | User created page with UploadWizard |
You cannot overwrite this file.
File usage on Commons
There are no pages that use this file.