File:Cells of the SOX2T-positive territory of the anterior primitive streak epiblast contribute to the neural tube and paraxial mesoderm tissues during axis formation chicken embryo.jpg

Original file (1,803 × 2,306 pixels, file size: 855 KB, MIME type: image/jpeg)
Captions
Captions
Summary[edit]
| Description |
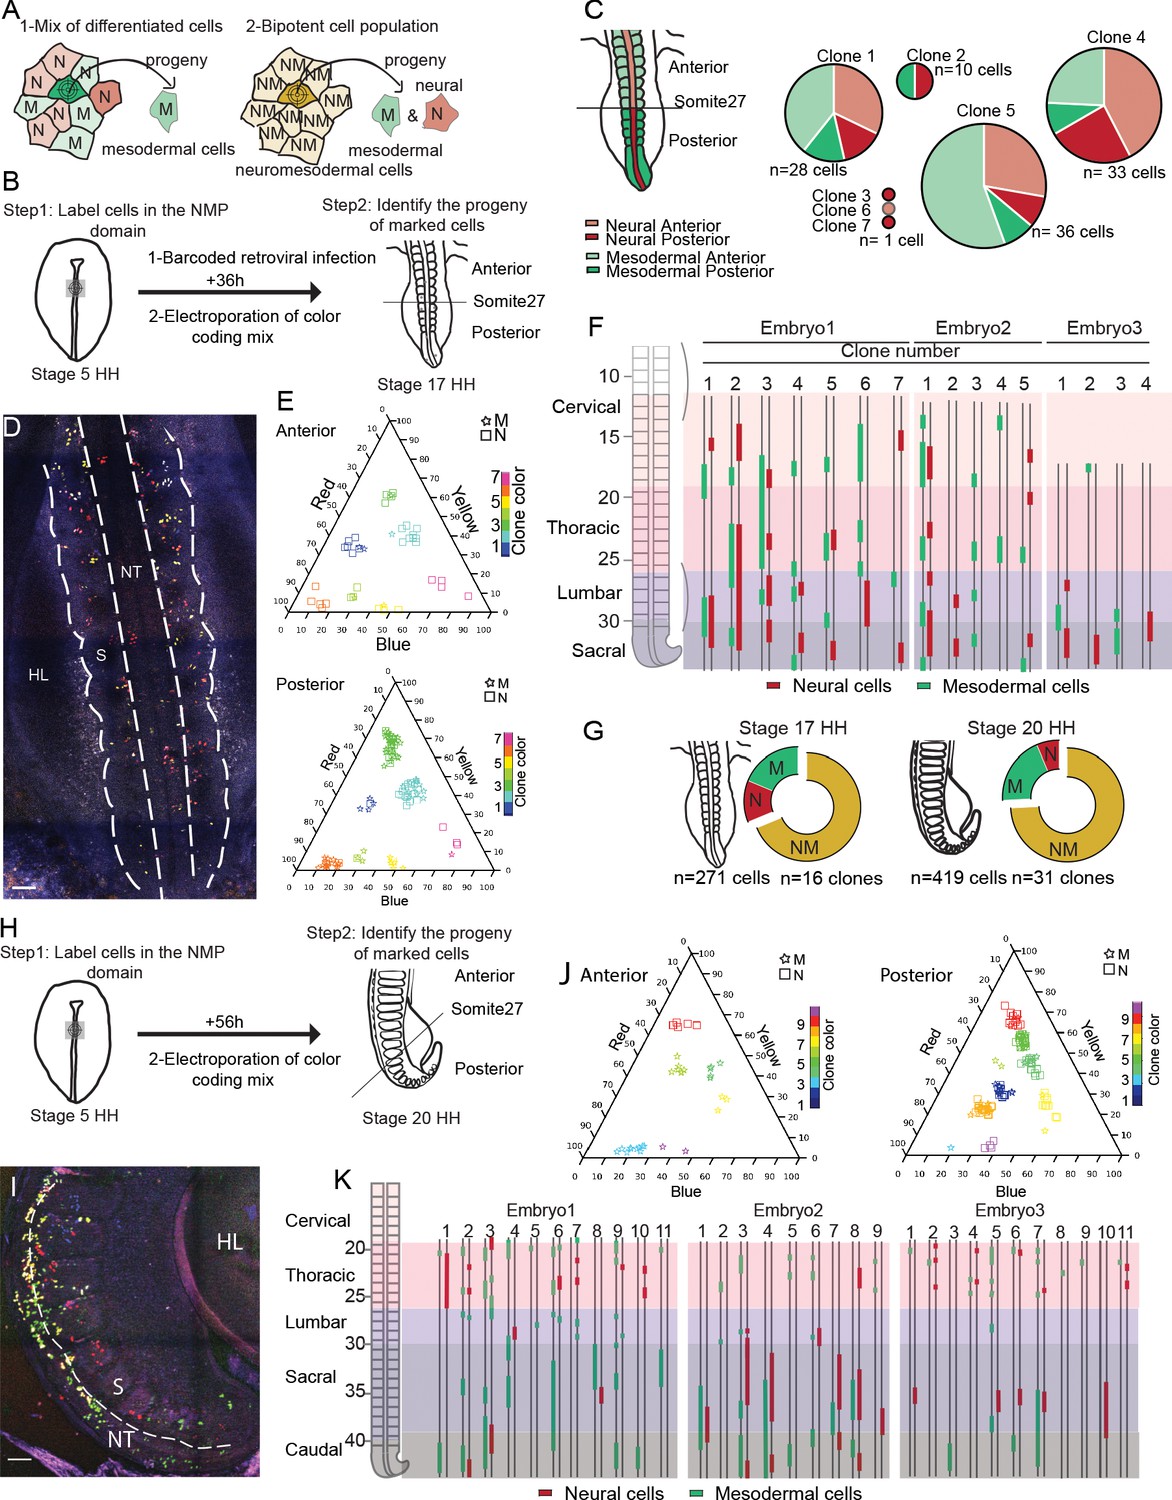
Figure 2—Cells of the SOX2/T-positive territory of the anterior primitive streak epiblast contribute to the neural tube and paraxial mesoderm tissues during axis formation. |
| Date | |
| Source |
https://iiif.elifesciences.org/lax/64819%2Felife-64819-fig2-v2.tif/full/,1500/0/default.jpg https://doi.org/10.7554/eLife.64819 Dynamics of primitive streak regression controls the fate of neuromesodermal progenitors in the chicken embryo eLife 10:e64819. |
| Author | Charlene Guillot Yannis Djeffal Arthur Michaut Brian Rabe Olivier Pourquié |

|
This file, which was originally posted to an external website, has not yet been reviewed by an administrator or reviewer to confirm that the above license is valid. See Category:License review needed for further instructions.
|
Copyright
© 2021, Guillot et al.
This article is distributed under the terms of the Creative Commons Attribution License, which permits unrestricted use and redistribution provided that the original author and source are credited.
Licensing[edit]
- You are free:
- to share – to copy, distribute and transmit the work
- to remix – to adapt the work
- Under the following conditions:
- attribution – You must give appropriate credit, provide a link to the license, and indicate if changes were made. You may do so in any reasonable manner, but not in any way that suggests the licensor endorses you or your use.
File history
Click on a date/time to view the file as it appeared at that time.
| Date/Time | Thumbnail | Dimensions | User | Comment | |
|---|---|---|---|---|---|
| current | 21:06, 1 May 2024 | | 1,803 × 2,306 (855 KB) | Rasbak (talk | contribs) | {{Information |description= Figure 2—Cells of the SOX2/T-positive territory of the anterior primitive streak epiblast contribute to the neural tube and paraxial mesoderm tissues during axis formation.<br> (A) Schematic diagram showing the strategy used to decipher if the neuromesodermal progenitor (NMP) territory is a mix of monopotent cells (left) or composed of bipotent cells (right). Schemes show an example of a cell that has been marked by retroviral barcoding or genetic color coding and... |
You cannot overwrite this file.
File usage on Commons
There are no pages that use this file.